DBPLUS Performance Monitor 2026.1 — more control, better integration and more convenient monitoring management

Artur Boguszewski

Version 2026.1 apps DBPLUS Performance Monitor brings a number of important changes that develop both the administrative layer and the integration capabilities of the system. The new features are designed for administrators and maintenance teams working in complex environments where configuration transparency, security of changes and easy access to monitoring data are important.
The update includes environments Oracle, SQL Server, PostgreSQL and SAP HANA, and part of the novelty has been implemented jointly for all platforms. Among the most important changes are: redesigned alert management, extended support for WorkTags, new REST API documentation, permissions based on instance categories, instance tagging, as well as new monitoring status controls. In addition, in the version for SQL Server a new process has been implemented applicator/writer, which increases the security of recording monitoring data.
One of the key changes in 2026.1 is a redesign of the alert configuration mechanism. The changes covered both areas Reasons &Problems definition, as well as Alerts definition, accessible from Configuration> Alert Settings.
The new management model replaces the previous division into Global Settings and Instance Settings A more transparent mechanism based on instance tree. This allows administrators to navigate the configuration more easily and quickly recognize at what level changes are being made — global, category, or single instance.
An added benefit is improved visibility of the inheritance of settings. Each definition shows the baseline information in the column Based on level. Marking All servers indicates the global configuration, Category means a definition created or modified at the category level, and Local signals the local setting for the specified instance or level.
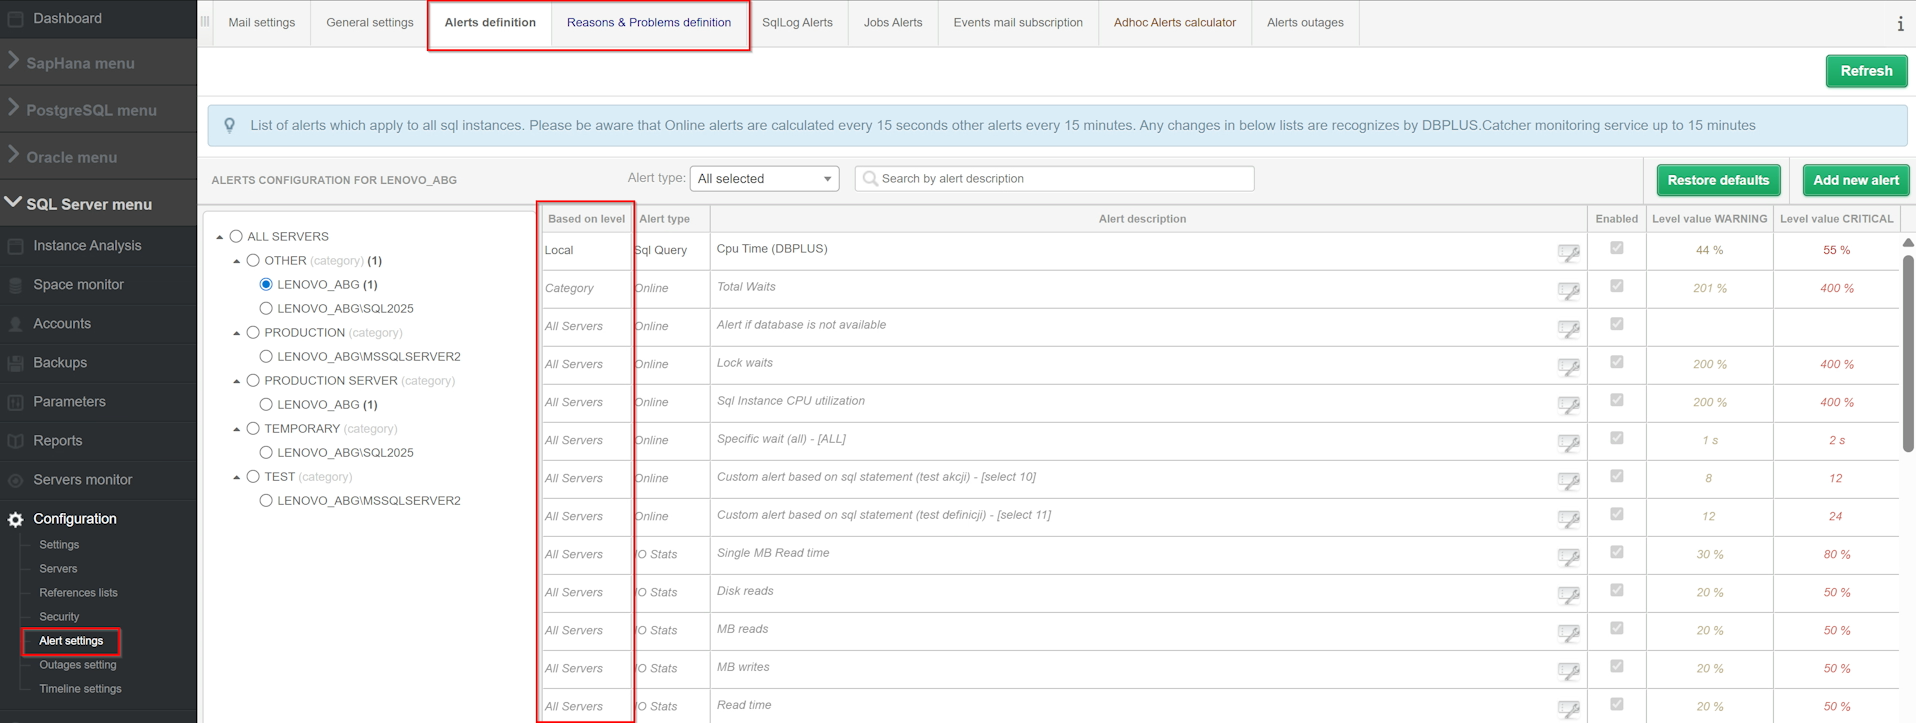
After selecting the appropriate level in the tree, the user receives a list of alert definitions assigned to the selected range. If you make a change, for example, at the category level, a number appears in the tree that corresponds to the number of changes to the definition Alle Servers.
The new layout reduces the risk of accidental configuration changes to the wrong extent and significantly improves the convenience of working in environments with multiple servers and categories.
An important element of the new alert management model is the full association of the configuration view with the user's permissions. The structure of the instance tree presents only those elements to which the user has appropriate access.
The ability to edit has been divided by levels:
If you do not have the appropriate permissions, the application notifies you of this with an appropriate message. Such a mechanism protects the configuration from unauthorized changes and supports consistent monitoring management throughout the environment.
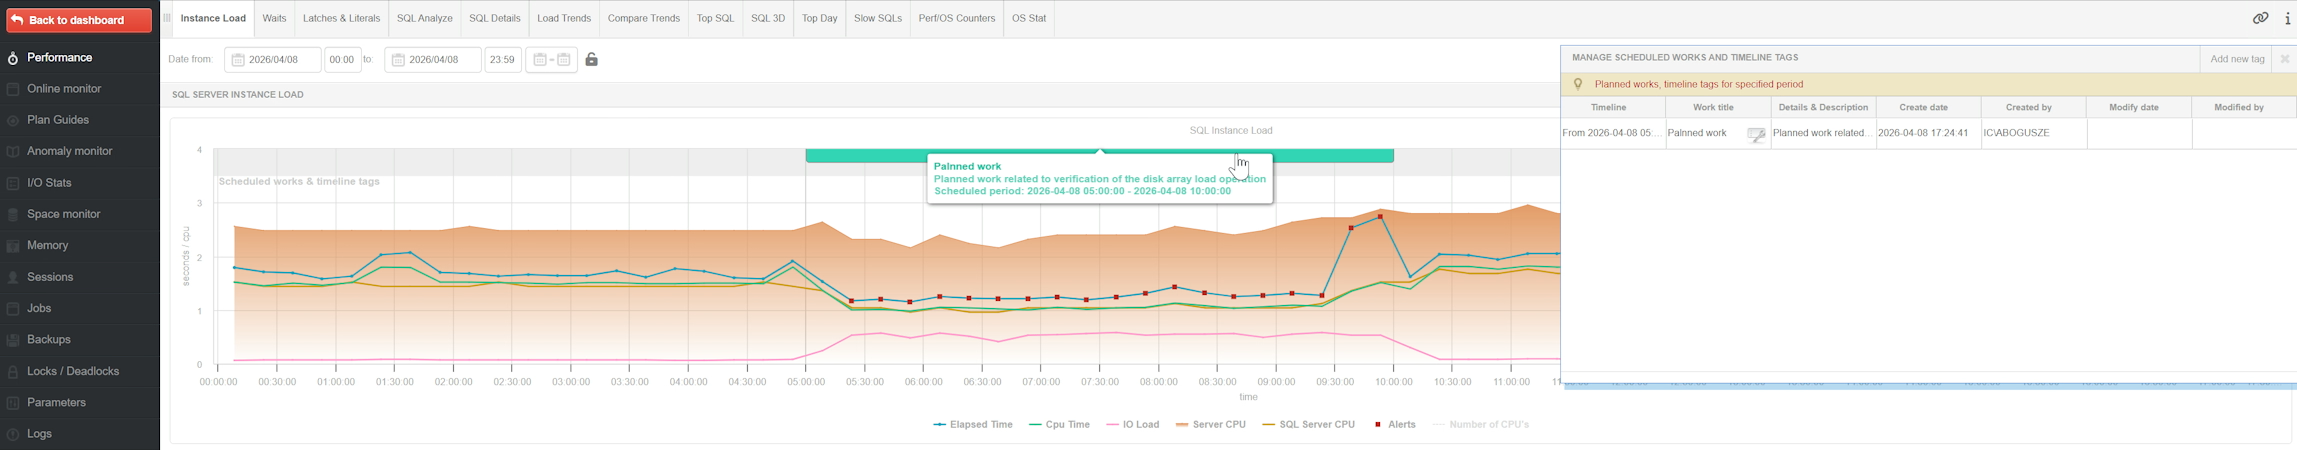
In version 2026.1, the functionality has also been expanded WorkTags, which allow you to mark important events and periods that are visible in the instance load charts.
The user can mark both a single event and the entire time interval that will be visible on the instance performance graph. This is especially useful in situations where we want to relate performance changes to actual actions performed in the environment.
Work Tags can be used to mark: planning work, administrative actions, optimization, incidents, single events affecting the load on the system.
This makes historical analysis much simpler. The administrator can interpret anomalies faster, check the impact of implemented changes and better document maintenance activities.
Work Tags available in GUI and via REST API
Tag support has been made available in two ways. The first is the graphical interface of the application, where tag management is possible directly from the chart after using the options Gestire Timeline. The second way is REST OF THE FIRE, which allows you to automate the creation and maintenance of entries.
This is an important extension for organizations that want to integrate monitoring with their own operational processes, reporting systems or automations.
Release 2026.1 also organizes the integration layer of the application. A new, more transparent version has been prepared RESTAPI documentation, which describes the currently available endpoints, their use, and example usage scenarios.
The documentation has been organized thematically and divided into two main areas:
Configuration and management
This part covers endpoints related to environment administration, monitoring configuration, and management of additional objects.
API Monitoring
The second area focuses on the collection of monitoring and diagnostic data.
This structured documentation facilitates the construction of own integrations and the use of DBPLUS Performance Monitor data in external reporting tools, operating systems or analytical mechanisms.
Documentation is available for both offline from within the app — by Help > Manual > REST API Documentation or the “i” icon — as and online, from DBPLUS servers.
Another important novelty is the ability to grant access to monitored instances based on their assigned category. This is a significant facilitation in environments where the number of instances is large and the structure of users and groups is extensive.
Previously, access to instances had to be defined directly for each instance. In version 2026.1, the administrator can additionally use the mechanism Category access, which automatically grants the user or group access to all instances assigned to the selected categories.
The new approach allows you to build an access model much faster and more flexibly. Importantly, combined configuration is also possible, i.e. simultaneous visibility based on specific instances and categories.
Version 2026.1 also introduces a feature Checking the monitoring status. The administrator can easily control the status of the monitoring service and the key threads responsible for data collection.
This information is available from Server monitor >Application architecture. The screen has been expanded with the status and activity date of the individual monitoring threads for each instance.
The following data are presented, among others: the last snapshot of the main thread, the activity of the Dashboard thread, the activity of the session monitoring thread.
In addition, monitoring status information can also be downloaded from REST API using the endpoint GET /health_check, which opens the way for the automation of the control of the correctness of the monitoring operation and integration with surveillance systems.
The most important change specific to SQL Server is the implementation of a new process applicator/writer, responsible for saving the selected data to the instance repository.
The mechanism covers, among other things, each area covered by monitoring.
The purpose of implementing the new process is to increase the reliability of the recording and improve the security of the data collected by the monitoring system.
If the repository is unavailable, the data is not lost — it goes to the buffer and is temporarily cached or on disk. When the repository is restored, the application automatically reads the overdue data and saves the missing snapshots.
This approach:
DBPLUS Performance Monitor 2026.1 is a release that clearly develops the application in three key areas: administrations, integration and reliability of operation.
Redesigned alert management organizes configuration and increases security of changes. Extended Work Tags and instance tags make it easier to analyze and organize your environment. New REST API documentation improves integration with external systems. A category-based entitlement mechanism is better suited to the needs of large organizations. In turn, the new features strengthen monitoring control and data security. As a result, the version 2026.1 is not just a technical update, but a real step towards more flexible, scalable and predictable monitoring of database environments.
Detailed information about the changes in the application can be found at the following link: SQL Server, Oracle, PostgreSQL, SapHana.