DBPLUS Performance Monitor 2025.1 — Overview of the most important changes

Artur Boguszewski

In the latest version of the application DBPLUS Performance Monitor we have introduced a set of changes that develop the application in the area of automation of response to alerts, log analysis, system monitoring and performance reporting. The new features are designed for administrators who need quick access to diagnostic information, greater configuration flexibility, and the ability to more easily integrate monitoring into day-to-day operational activities. Among the most important novelties were the mechanisms for launching commands after the occurrence of an alert, extensive alerts based on SQL Error Log, the ability to download operating system statistics from the server and improve the report Rapport de performance. This makes DBPLUS Performance Monitor even more effective in supporting performance analysis and automation in database environments.
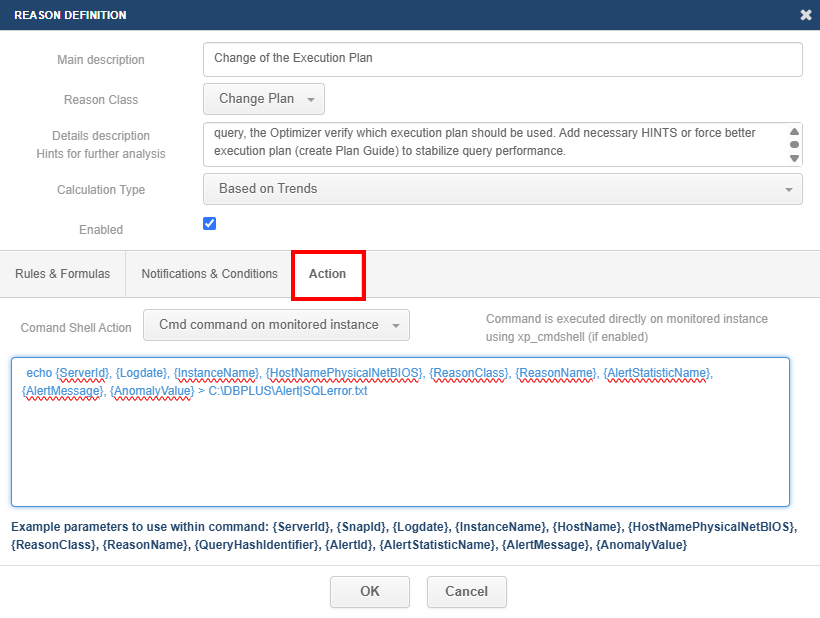
In the latest version, the possibility of launching additional system actions after the occurrence of an alert has been added, which allows to extend the monitoring mechanism with an element of automatic response to events. For each alert, the administrator can now configure the execution of the CMD command or PowerShell directly from the Reasons & Problems Definition tab, under Akcija available in the details of the alert. Functionality works both for alerts executed onlineas well as those calculated cyclically snap. Thanks to this, DBPLUS Performance Monitor can not only detect irregularities, but also initiate defined operational actions, supporting the automation of administrative processes and shortening the response time to incidents.
When configuring an action, the user can enter their own command and enrich it with special tags that are automatically populated when the alert occurs, such as the instance ID, the event date, the instance name, the class and name of the alert, the query ID or the content of the alarm message. This makes it possible to build more dynamic integration scenarios, such as passing alert details to external scripts, notification systems or tools that automate actions on the infrastructure side. In addition, the application provides logs of the execution of such actions in the menu Servers Monitor > Logs, in the Event Logs tab, where the user can check the execution date, instance context, status and basic information about the executed command. It is worth remembering that the application does not verify or block the content of the commands given by the user, so the configuration of this function should be carried out consciously and in accordance with the security rules in force in the organization.
A detailed description of the changes has been provided in the update documentation for platforms Oracle, SQL Server, PostgreSQL and SAP HANA.
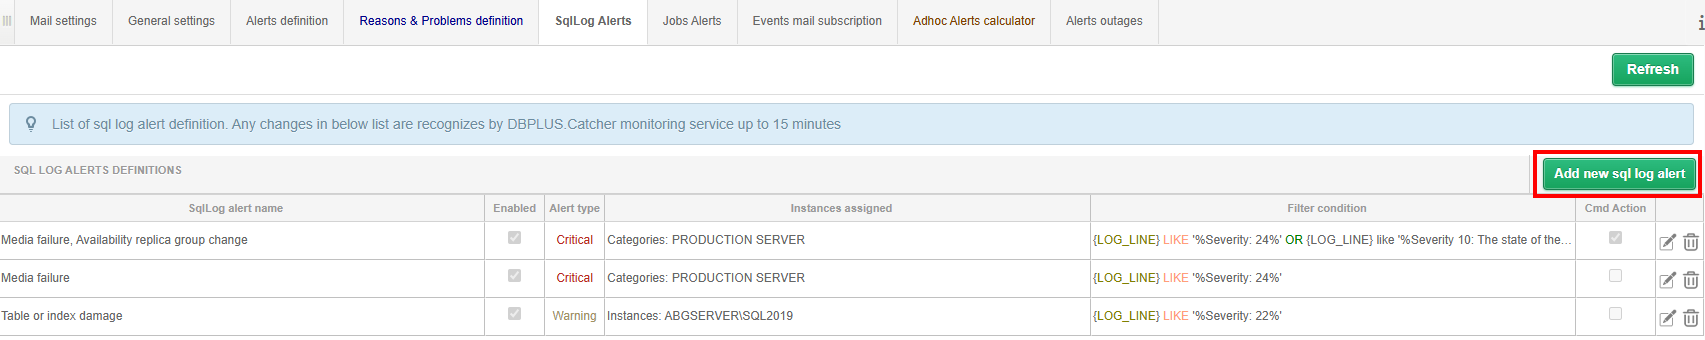
In the latest version of DBPLUS Performance Monitor we have expanded the mechanism of alerts based on SQL Error Log, giving administrators more flexibility to detect and handle events that appear in SQL Server logs. Alert configuration is available in the menu Configuration > Alert Settings >SQL Log Alerts and has been expanded with the ability to define a single event simultaneously for multiple instances or entire instance categories. In addition, we have introduced more advanced filtering of log entries — the user can build conditions using operators LIKER, AND, OR and NOT, as in SQL, using the expression {LOG_LINE} in the filter definition. The new version also allows you to more precisely control the number of occurrences of an event necessary to generate an alert and specify how often the log should be checked. This makes it possible to better match the sensitivity of alerts to the characteristics of the specific environment and more effectively reduce the number of false alarms.
We have extended the functionality of responding to an alert, allowing you to perform an additional action when an event is detected. The administrator can configure the command to run CMD or PowerShell locally on the application server or directly on the monitored instance using options based on xp_cmdshell. In a command, you can use tags associated with an alert that are automatically populated when it occurs, allowing you to build flexible integration scenarios and automate operational activities. Information about the actions performed is recorded in the logs available in the Servers Monitor > Logs menu, in the Event Logs tab, where the user can verify the details of the executed commands. It is worth remembering that the application does not verify or block the commands defined by the user, so the configuration of this function should be carried out carefully and in accordance with the security rules in force in the organization.
Detailed information about the changes for SQL Server is available at links.
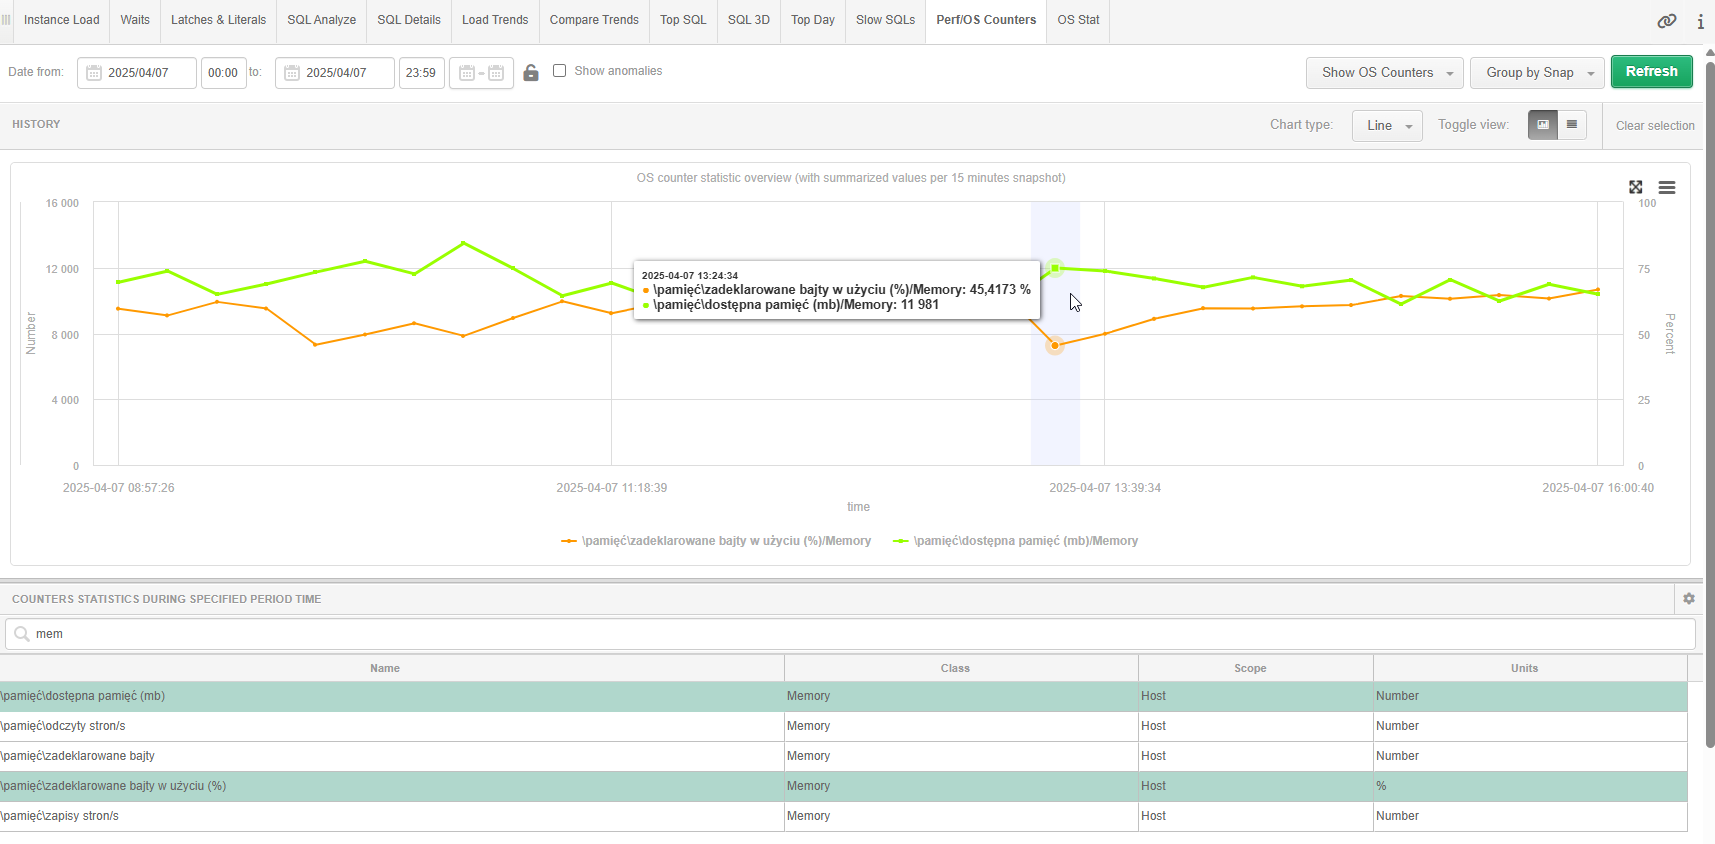
In the latest version of DBPLUS Performance Monitor we have added the ability to download selected operating system statistics directly from the server running the monitored instance SQL Server. The data is read from the SQL Server instance using the xp_cmdshell command, which runs powershell.exe, so that the user can analyze the selected system parameters without leaving the application. This information is available in the instance details, in the Perf/OS Counters tab, when you select Show OS Counters. In the current version, we have provided a set of the most important statistics divided into classes: Network, IO, Memory, CPU and System, allowing you to more quickly associate performance issues of a SQL Server instance with the health of the operating system itself.
The configuration of this functionality is implemented from the program DBPLUS Configuration Wizard running on the application server. Administrator by selecting the appropriate instance and going to Options Refresh privileges, can enable the ability to download OS statistics by specifying the login and password of the user with startup rights xp_cmdshell. The configuration must be done separately for each monitored instance, and disabling the functionality is done in the same place by deselecting the option Use xp_cmdshell. This enhancement extends the scope of DBPlusPerformance Monitor with additional system context that can be extremely helpful in diagnosing performance issues and analyzing the behavior of SQL Server instances.
Detailed information about the changes for SQL Server is available at links.
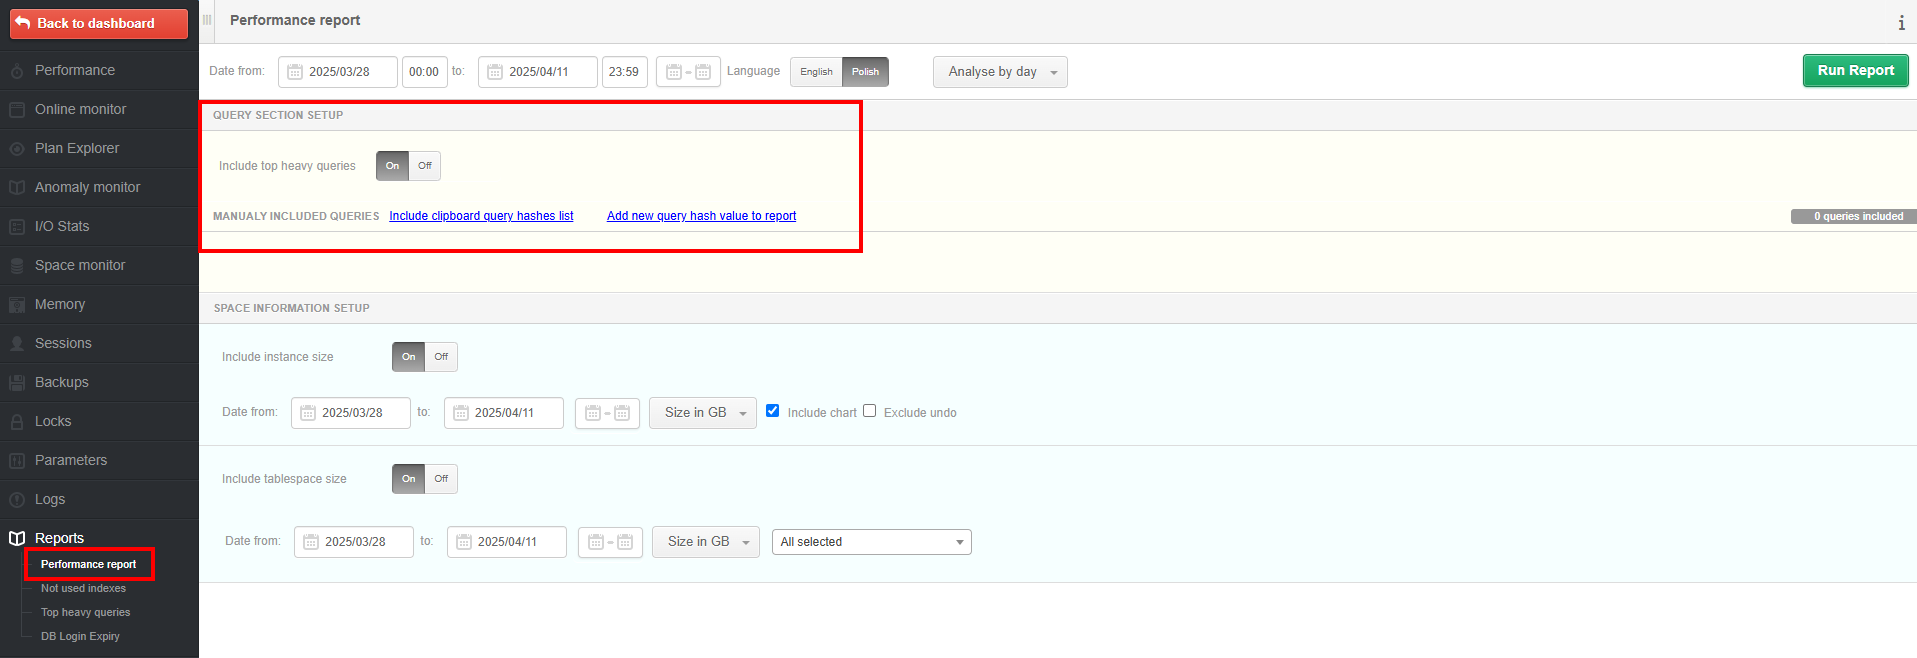
In the latest version of DBPLUS Performance Monitor, we have expanded the Performance Report, giving users more freedom to analyze the performance of instances. The most important change is the ability to add your own queries to the report, which you want to include in the statement next to the data presented as standard. Until now, the report focused on the section presenting statistics of the top queries executed in the selected time interval, but now the user can independently extend the analysis to the queries of interest using the QUERY SECTION SETUP section. You can import query IDs from the clipboard using Include clipboard query hashes list or add them manually by selecting Add new query hashvalue to report. Additionally, if you want to focus solely on your own list of queries, you can disable the presentation of standard top queries by deselecting Include top heavy queries.
The changes also included the SPACE INFORMATION SETUP section, which is responsible for the presentation of data on the occupancy of instances. In the latest version, we have improved the ergonomics of generating the report and the way of presenting data, especially in the case of analysis of information grouped by hour. Thanks to this, the report has become more readable, flexible and better suited to the needs of users who want not only to use the ready-made analyzes provided by the application, but also to independently extend the report with their own diagnostic context. This enhancement adds to the practical value of the Performance Report as a tool to support performance analysis and more accurate reporting for administrators and technical teams.
A detailed description of the changes has been provided in the update documentation for platforms Oracle, SQL Server, PostgreSQL and SAP HANA.
Summary
Changes made in the version 2025.1 strengthen the DBPLUS Performance Monitor as a tool not only to observe the database environment, but also to actively support administrative and diagnostic activities. The ability to execute commands after an alert occurs and the expansion of alerts based on SQL Error Log opens up new scenarios for automation and faster response to incidents. Downloading operating system statistics from a monitored MSSQL instance provides additional context needed to analyze performance issues, and the improved Performance Report gives users more freedom to build their own reports and analyses. Together, these improvements translate into greater control, better visibility of the operation of the instance, and more comfortable working with the application on a daily basis.