DBPLUS Performance Monitor 2025.2 — more controls, better alerts and automation

Artur Boguszewski

In the latest version of DBPLUS Performance Monitor, we focused on further developing features that support database administrators in their daily work related to monitoring, alerting and automating environmental management. The changes include both environments Oracle, SQL Server, and PostgreSQL, responding to real-world needs for faster problem detection, better event analysis, and more convenient access and configuration management. Among the most important innovations were improvements in monitoring Oracle Alert Log, expansion of the alert mechanism, extension of the monitoring of the occupancy of database files with parameters Autogrowth and new REST API options related to user management and retrieval of alert data. It is a set of changes that strengthens both the operational and integration layers of the application.
In the latest version of DBPLUS Performance Monitor we have expanded the functionality related to Oracle Alert Log, introducing the ability to conveniently enable and disable its monitoring from several levels of the system. Log read management is now available both from within the application, directly in the details of the monitored instance in the tab Logs > Oracle Alert Logas well as from the program DBPLUS Configuration Wizard. In each of these locations, the administrator can, after granting administrative account permissions, decide to activate or deactivate the Oracle Alert Log read option. As a result, the monitoring configuration has become more flexible and better suited to different administrative scenarios and the Oracle environment management model.
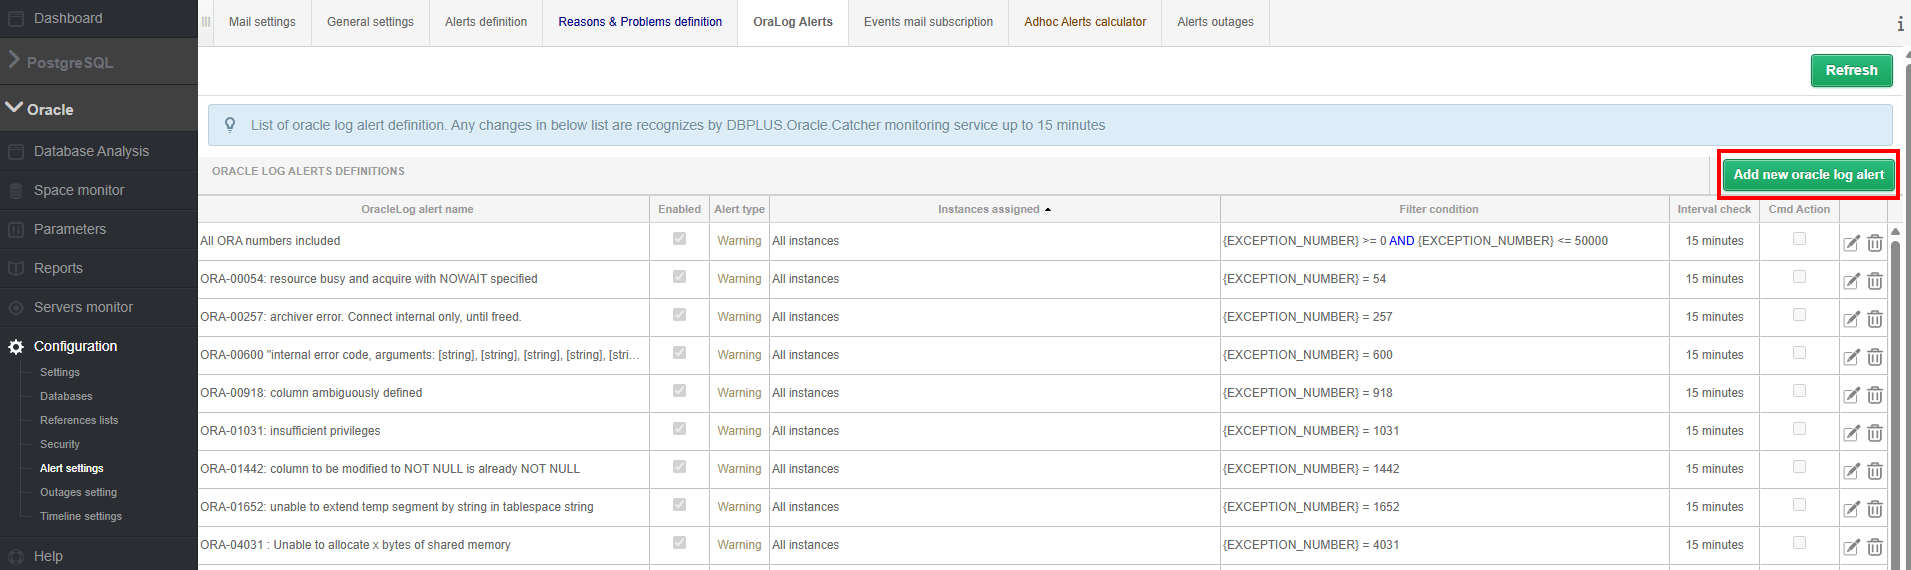
In parallel, we have introduced a number of improvements in the area of alerts based on Oracle Alert Log. Alert configuration is available in the menu Oracle Alert Log Configuration and in addition, it can be managed directly from the log screen using the button Manage Alerts. The new version allows you to define alerts simultaneously for multiple instances or entire instance categories, as well as apply more advanced conditional filters using operators LIKE, AND, OR and NOT. The administrator can also specify the frequency of the log check and the number of occurrences of the event required to trigger the alert, which allows to reduce the number of false alarms and better adapt the detection mechanism to the specifics of the environment. In addition, for each alert, you can configure the action to be executed after it occurs, using the commands CMD or PowerShell, with the possibility of using tags that are automatically replenished when the alarm is triggered. This extension makes Oracle Alert Log monitoring not only a source of diagnostic information, but also an element of active event response automation.
A detailed description of the changes has been made available in separate materials for the platforms Oracle, SQL Server, PostgreSQL and SAP HANA.
In the latest version of DBPLUS Performance Monitor, we have improved the alert calculation mechanism to even more effectively detect real performance problems in monitored environments. One of the most important changes concerns the additional verification of daily statistics when analyzing waits and comparing historical trends. This allows the system to better recognize situations in which there are short-term but very high increases in the value of a given weight. In previous scenarios, such sudden spikes may not always result in an alarm being generated, despite a noticeable impact on instance performance and query execution time. This change reduces this risk and improves the efficiency of detecting incidents that are of real operational importance.
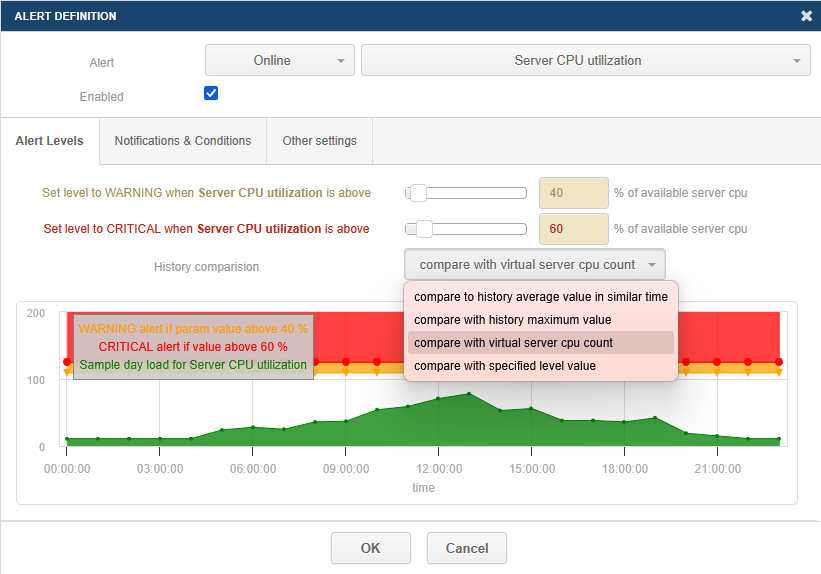
We have also expanded the area of performance-related alerts AND/OR, adding new mechanisms to detect problems related to both disk operation time and waits characteristic of input/output bottlenecks. Updated the list of waits analyzed for I/O problems, improved the logic of counting averages for statistics change write time, single block read time and single block write time. We have added detection of queries that generate a high level of changes saved to the log file. In addition, we have expanded the configuration of online alerts with new comparison options: Comparewith virtual server cpu count and Comparewith specified level value. These changes include alerts related to Server CPU Utilization, SQL Instance CPU Utilization, Total waits and Active session, giving administrators more flexibility in defining thresholds and better matching alerts to the characteristics of the monitored environment.
A detailed description of the changes has been made available in separate materials for the platforms Oracle, SQL Server, PostgreSQL and SAP HANA.
In the latest version of DBPLUS Performance Monitor, we have extended the monitoring of database file occupancy in SQL Server with detailed information related to the mechanism Autogrowth. The user can now check at the file detail level, in Group by file view, not only the current size of data files and logs, but also parameters such as Auto growth, Growth and Max size. In addition, the application collects information about the available storage space for volumes on which data and log files are located, which allows you to better assess the real possibilities of further growth of the base. This data is visible both in the Current Space tab in the Space Monitor menu and at the his tory level, so that the administrator can analyze not only the current state, but also the changes that occur over time.
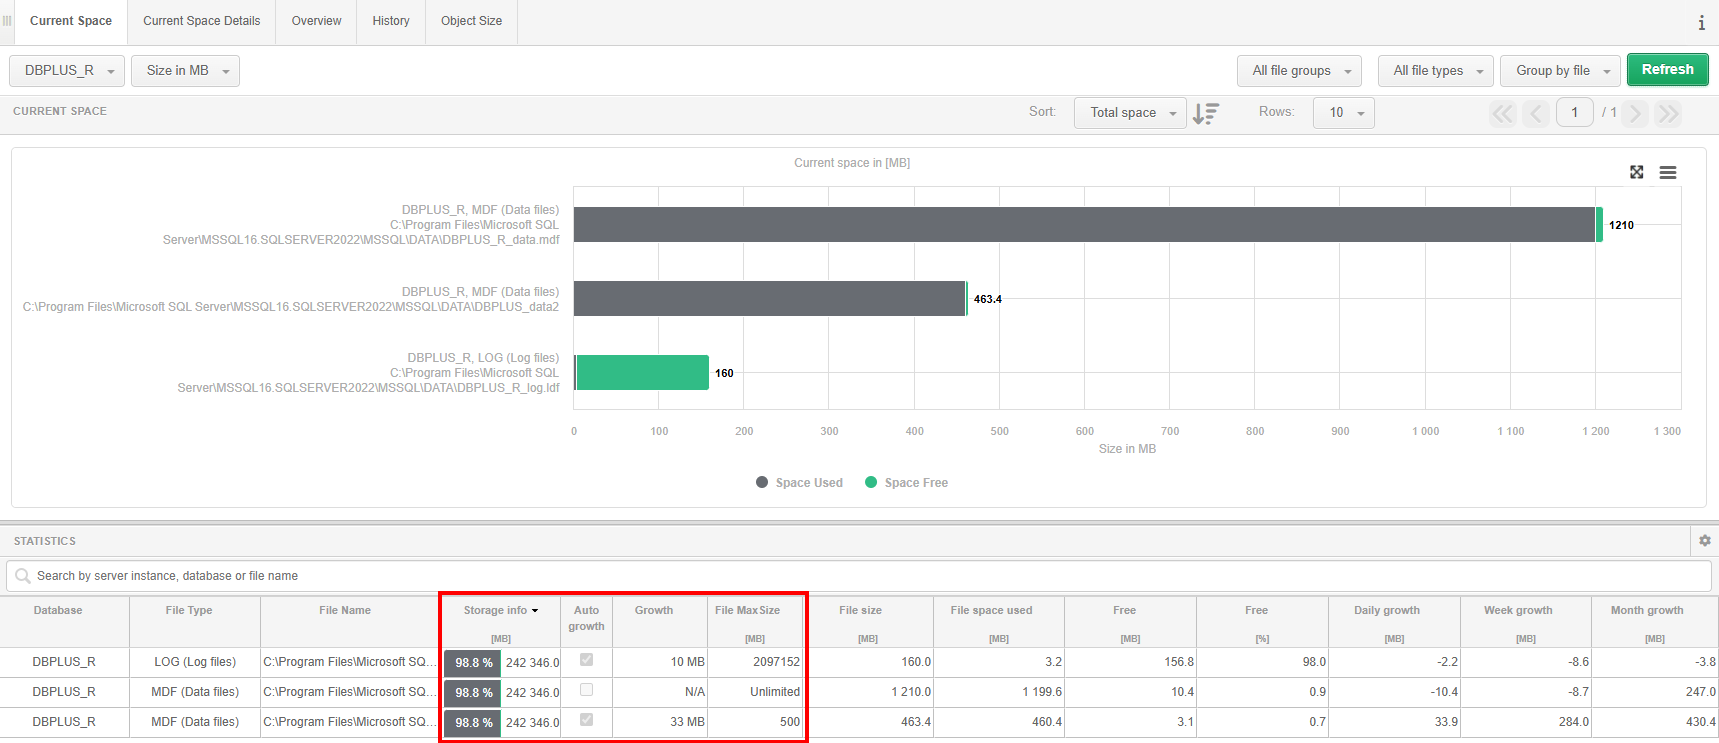
We have updated the alert responsible for controlling the size of data files and logs, expanding it with additional parameters important from the point of view of security and continuity of the instance. The alert now includes, among other things, the setting Autogrowth, value Growth, limit Max File Size, disk space availability - Storage info and size filegroups. This allows for much more accurate detection of situations where the database is nearing growth limits or may encounter storage limitations. Note that the alert is not configured by default — its definition must be created in the menu Configuration> Alert settings by selecting the type of alert DB-size and specifying whether to apply to data files or logs. After you save the definition, you can create the right alert, assign it to the appropriate rule, and set the frequency of notifications, which allows you to tailor the alert mechanism to the requirements of your specific environment.
A detailed description of the changes is provided in separate materials for SQL Server.
In the latest version of DBPLUS Performance Monitor, we have expanded the capabilities of REST API with two important features that increase the scope of application integration with external systems and automation of administrative processes. The first of these is application access management, which allows you to retrieve information about users, groups, and profiles, and remotely add, modify, and delete objects that are responsible for permissions. The functionality has been made available through the new /userlist paths and /SecurityManage, available for MS SQL, Oracle and PostgreSQL environments. Thanks to this, administrators can not only read the current access configuration, but also manage it programmatically, from external tools or their own processes that automate the administration of the DBPLUS environment. The API supports both users and groups with their own permissions, as well as objects that use permissions inherited from profiles, while maintaining full control over the scope of access to instances and functionality of the application.
The second novelty is the extension of the endpoint /alerts additional parameter class, which allows you to filter returned alerts by problem class. This enables even more precise retrieval of alert data and easier integration with reporting systems or incident analysis mechanisms. The user can limit the results, for example, to alerts related to query performance, I/O, CPU, locks or other monitoring areas, depending on the database platform. The new parameter significantly increases the usefulness of the REST API in the daily work of administration and integration teams, as it allows you to reach specific data faster without having to process the entire list of events. This is another step in the development of DBPLUS Performance Monitor as a platform not only for monitoring, but also for effective integration and automation of database environment management.
A detailed description of the changes is provided in separate materials for Oracle, SQL Server, PostgreSQL platforms.
The latest changes in DBPLUS Performance Monitor show the consistent development of applications towards even greater monitoring precision, better automation and greater configuration flexibility. Enhanced Oracle Alert Log monitoring allows you to analyze events more effectively and build more advanced alert scenarios, an improved alert engine better identifies real performance issues, and new information about Autogrowth and database file parameters increases control over the space and security of your SQL Server instance. In turn, the development of REST API opens up new possibilities for integrating DBPLUS Performance Monitor with external systems and administrative processes. Together, these changes translate into greater convenience for administrators, faster access to key information, and more effective management of the database environment.