DBPLUS Performance Monitor 2026.2 – more control over performance and alerts

Artur Boguszewski

Version DBPLUS Performance Monitor 2026.2 introduces improvements for monitoring Oracle, Microsoft SQL Server, PostgreSQL, and SAP HANA databases. This update focuses primarily on enhancing the alerting module, expanding the REST API, reporting performance statistics, and improving the management of large-scale environments.
One of the most significant changes in version 2026.2 is the expansion of the alert handling process. Every alert event is now assigned one of three statuses:
The New status indicates a new event requiring attention. If the alert conditions are still met in the next snapshot, its status changes to In Progress. This makes it easy to distinguish between new issues and events that have been ongoing for some time.
An alert is assigned the Closestatus once the monitored value no longer exceeds the defined threshold. By default, at least two consecutive snapshots where the issue conditions are no longer met are required. This mechanism reduces the risk of premature alert closure caused by temporary improvements or short-term fluctuations in values.
The number of snapshots required for automatic alert closure can be adjusted in the alert configuration. Information about the current status is also available via the REST API in the endpoint response /alerts, in the AlertStatus.
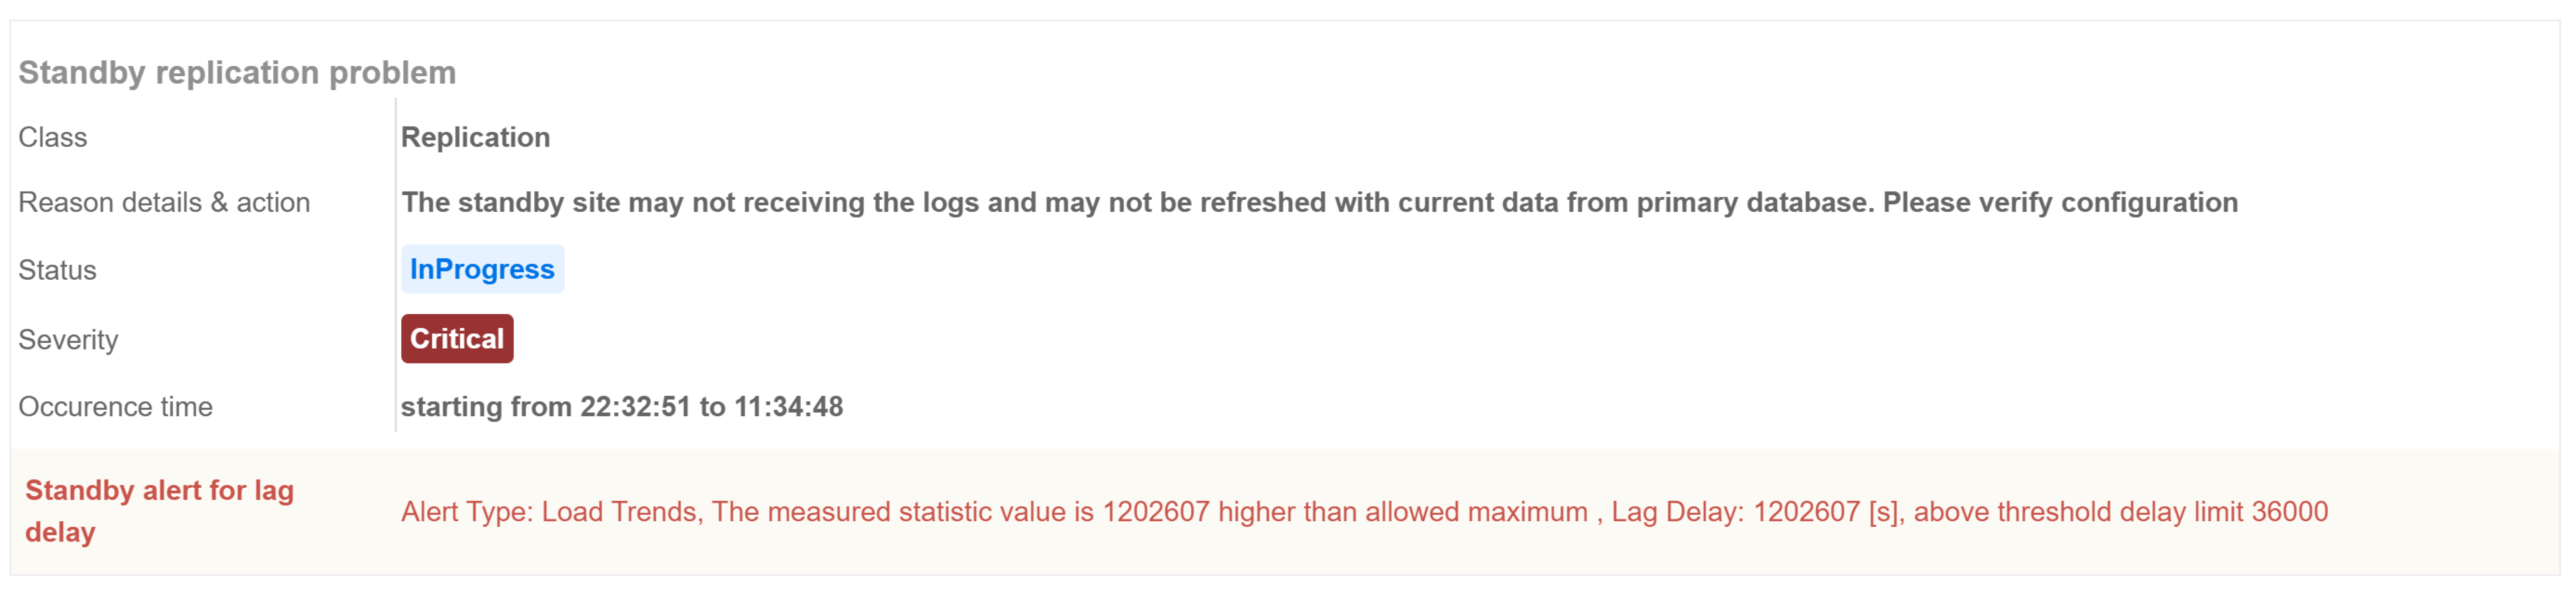
We have expanded the alert notification configuration. Notifications can now be sent, among other triggers:
The availability of specific options depends on whether the configuration applies to an Onlineor Load Trendsalert. This helps reduce the number of unnecessary messages and better tailor communication to the significance and duration of the issue.
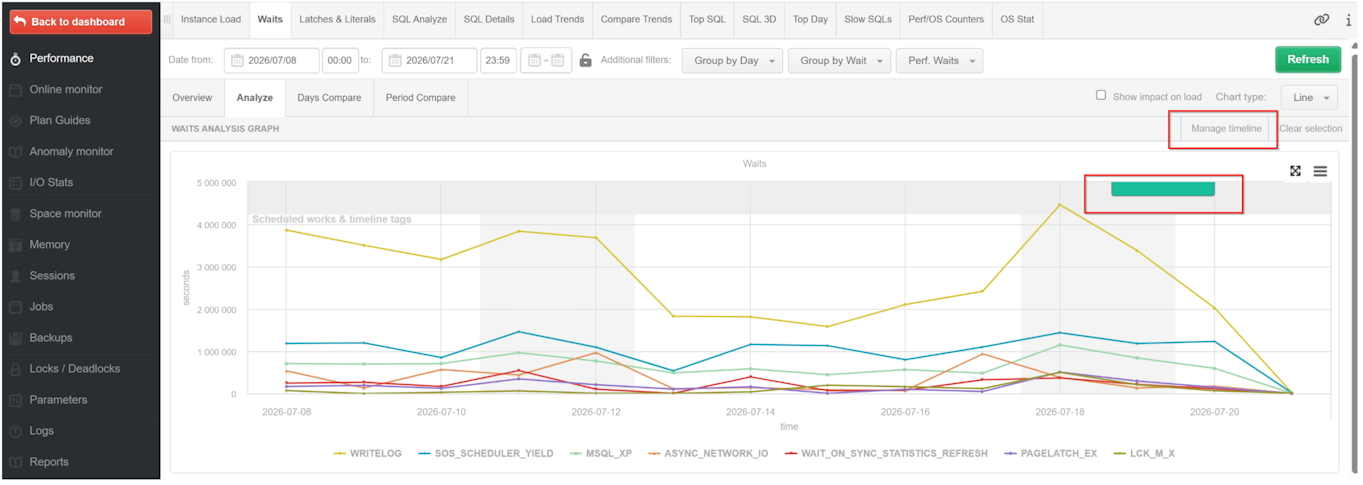
In the Oracle and SQL Server versions, you can create alerts based on Performance Counters. SQL Server additionally allows the use of operating system counters, i.e., OS Counters.
The alert threshold can be compared against:
This feature allows you to detect unusual instance and server behavior without being limited solely to standard load metrics.
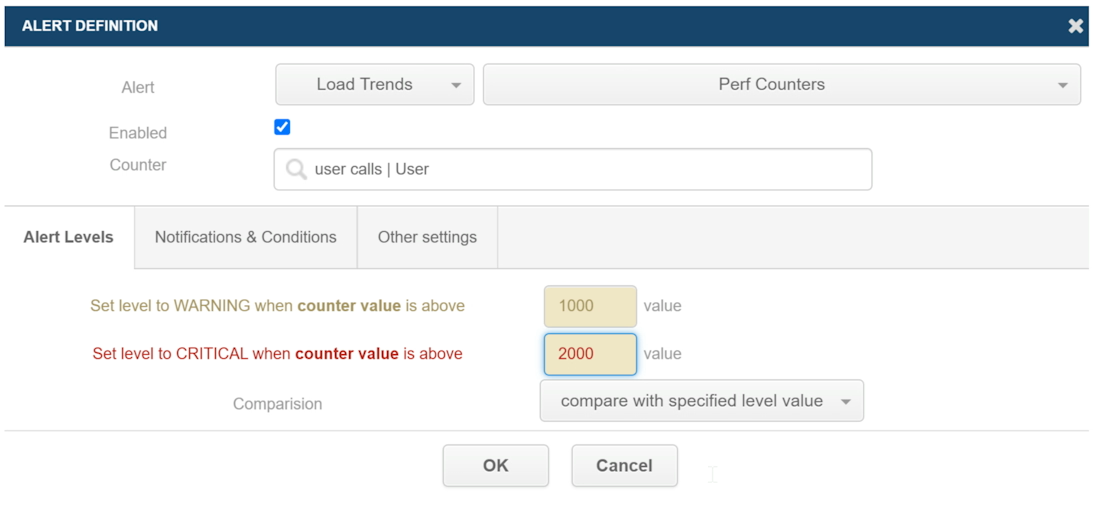
The functionality Work Tags has been extended to additional areas of the application. Tags allow you to mark both individual events and entire time ranges associated with specific activities in the environment.
Tags can be used to describe, among other things:
Until now, tags were primarily available on the main instance load chart. Following the update, they are also visible on the following screens:
Tags can be added and viewed from the application interface using the Manage Timelinefeature. Event management can also be automated via the REST API. The /worktags endpoint allows you to retrieve information, while /worktagmanage lets you create, modify, and delete entries.
Version 2026.2 expands the range of data and operations available via the REST API.
The new Queries endpoint provides information on the most resource-intensive queries. This data can be used in external dashboards, reports, diagnostic tools, and optimization processes.
For SQL Server and PostgreSQL, we have also added the SpaceSize endpoint, which allows you to retrieve information about space usage by monitored resources.
Integration InstanceManage has been expanded to include the ability to change the monitoring user password. This facilitates credential rotation automation and the implementation of security procedures.
The Dashboard endpoint has also been improved to handle situations where some monitoring data is temporarily unavailable.
One of the most significant changes in Oracle monitoring is the new SQL query grouping mechanism. It allows queries with identical or very similar content, differing only in literal values, to be presented as a single entry.
Examples include the following queries:
SELECT * FROM ORDERS WHERE ORDER_ID = 1001;
SELECT * FROM ORDERS WHERE ORDER_ID = 1002;
SELECT * FROM ORDERS WHERE ORDER_ID = 1003;
Although each has different text and a different literal value, they perform the same operation from a business process perspective. Grouping allows you to analyze their combined impact on database performance instead of reviewing many nearly identical entries.
This mechanism is particularly useful in environments that generate a large number of dynamic queries with literals, as well as for queries marked with the MARKHOTmechanism.
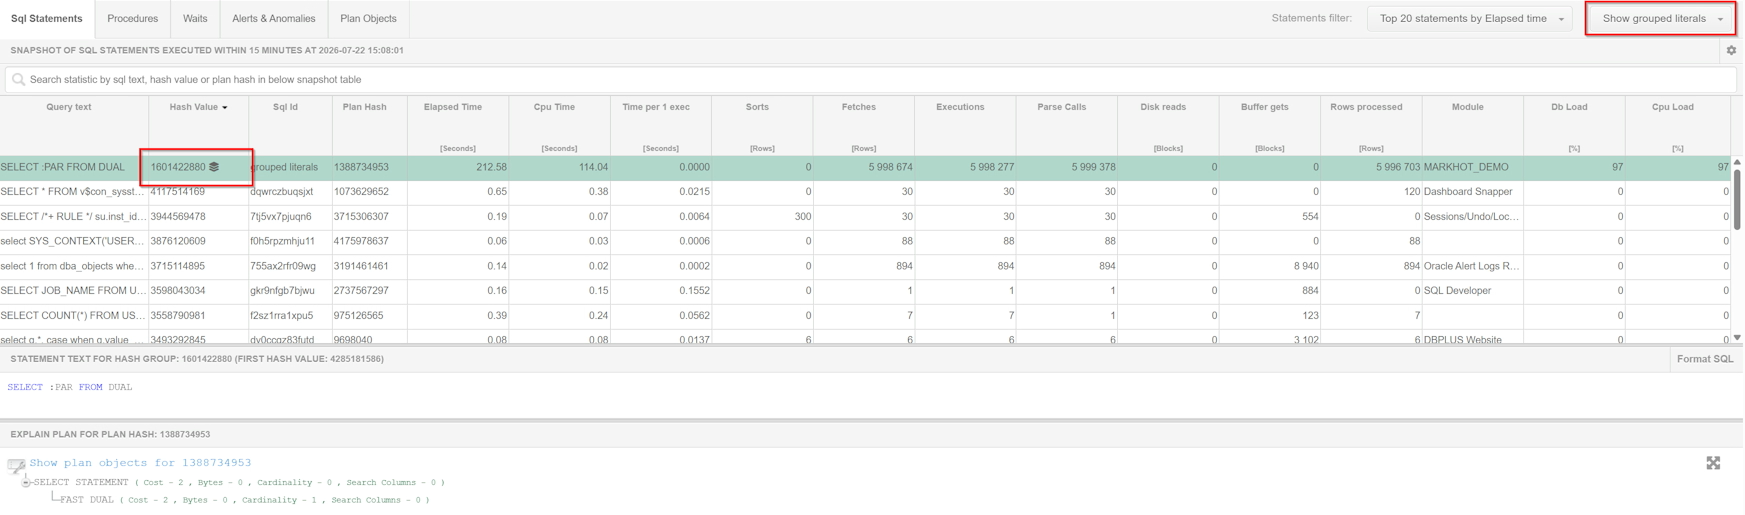
Users can switch between two modes:
Query groups are marked with a dedicated icon in the Hash value columnIn the SQL details, you can drill down from group-level statistics to individual query data, view all versions containing literals, and automatically highlight differences between SQL texts.
The solution improves the readability of monitoring screens and allows you to quickly determine whether the source of the load is an entire business operation type or just a specific query version.
Information about the number and size of ArchivedLog files is now stored in the DBPLUS repository.
This gives the user access to historical data even when it is no longer available directly on the monitored instance. The default chart shows the last 14 days and allows for the analysis of queries generating logs on a selected day.
Version 2026.2 also introduces several changes to improve daily workflows:
Refreshing monitoring user permissions is now available directly from the application interface. Access to this feature can be controlled via permissions in the Security menu.
We have also added the ability to specify additional connection string parameters when connecting an instance or editing an existing configuration.
Memory usage by the DBPLUSCATCHER service has been improved for environments that generate a large number of queries with literals retrieved from the XEvents queue.
A fix has also been implemented in the Space Monitor module regarding the updating of logical names and file paths.
An additional process has been implemented applier/writer, responsible for securely writing diagnostic data to the repository.
If the DBPLUS repository is temporarily unavailable, data collected from monitored instances is saved locally in files on the application server. Once the repository becomes available again, the process automatically reads the data from the buffer and saves the missing snapshots.
The mechanism includes, among other things:
Data is stored in the following directory:
C:\ProgramData\DBPLUS\DPM.Postgres.Web\Appliers
The process runs independently and in parallel to standard monitoring. It reduces the risk of data loss during short-term repository availability issues and maintains the continuity of data collection.
The administrator can configure:
The default file retention period is six hours. Information about the process operation is available in the Servers monitor > Logsmenu, under the tab Applier/writer procedure runtime.
DBPLUS Performance Monitor 2026.2 makes it easier to track the alert lifecycle, analyze queries, and integrate with external systems.
New features increase monitoring reliability, simplify the management of large environments, and allow for better correlation between performance issues and infrastructure changes.