What's New in DBPLUS Performance Monitor 2025.3

Artur Boguszewski

In the latest version of DBPLUS Performance Monitor, we have introduced a number of significant improvements that develop the application in four key areas: security, task monitoring, performance analysis and observation of replication mechanisms. The new features are designed to better support database administrators and IT teams working with Oracle, SQL Server, and PostgreSQL environments. Among the most important changes were the implementation of the MFA mechanism, the extension of MSX job monitoring, the addition of the Missing Indexes report and the improvement of PostgreSQL logical replication monitoring. Thanks to these changes, DBPLUS Performance Monitor provides an even higher level of security, better control over the processes taking place in the database environment and faster access to the information necessary for daily administration and optimization.
In the latest version of DBPLUS Performance Monitor, we have implemented the MFA (Multi-Factor Authentication) mechanism, which significantly increases the level of security of access to applications. From now on, in addition to the standard password, the user confirms his identity with an additional authentication component - a one-time code sent by SMS or generated in an authentication application such as Google Authenticator or Microsoft Authenticator. The solution is integrated into the login module and can be enabled or disabled at the user account level, which allows you to flexibly adjust the authorization method to the security policy in force in the organization. As a result, companies using Performance Monitor can more effectively reduce the risk of unauthorized access to data and system functions.
The new functionality is designed to integrate with Microsoft Entra ID (Azure AD), which allows central access management and convenient configuration of users and domain groups. The administrator can define the connection parameters in the Security section, complete the required data such as Client ID, Tenant ID and Redirect URL, and then assign users the appropriate permissions to the monitored instances and functionality of the application.
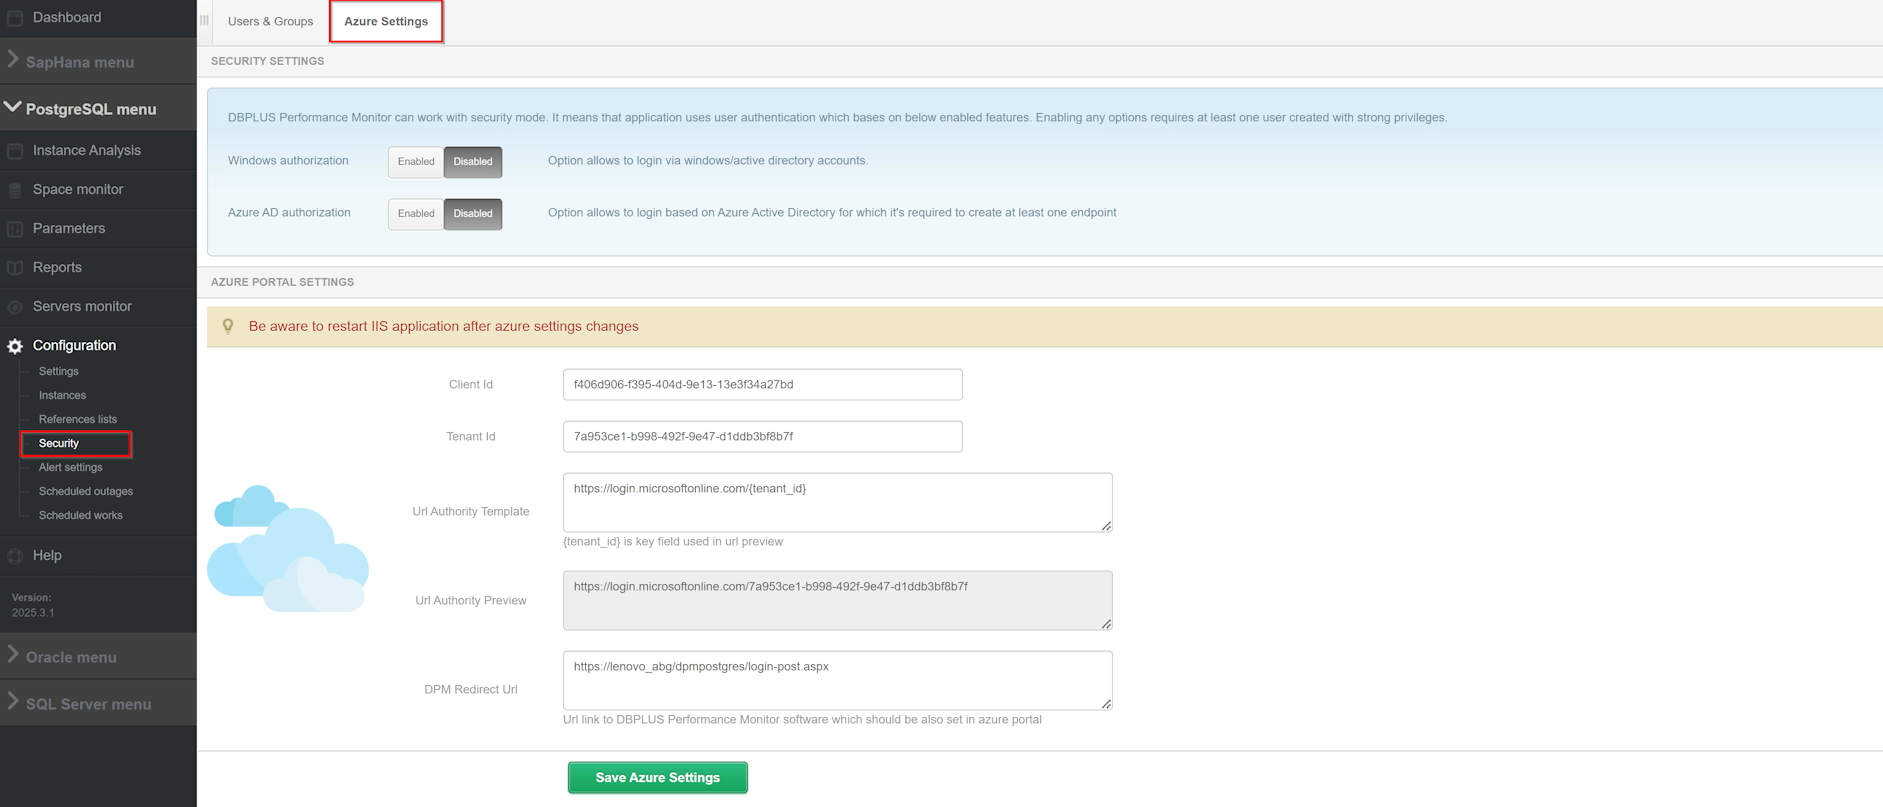
DBPLUS Performance Monitor supports both Windows AD and Azure AD-based authentication at the same time, making it possible to use one or both login models in parallel. In practice, this means not only greater security, but also greater ease of administration and compliance with modern standards of protection of access to company systems.
Detailed information on changes for the platform Oracle are available under links.
In the latest version of DBPLUS Performance Monitor, we have expanded the task monitoring area with support for Multi-Server (MSX) jobs. With this, users can now track the history of multi-server tasks directly from the monitored instance, in Job, giving you a more complete picture of what you're doing in a SQL Server environment. In addition, we have introduced a new column Originating server name, which indicates the source server from which the task was ordered. Locally running jobs display the Local value, which makes it easy to quickly distinguish local tasks from those managed centrally in MSX. This improvement increases the transparency of monitoring and allows more efficient analysis of job performance history in more extensive administrative environments.
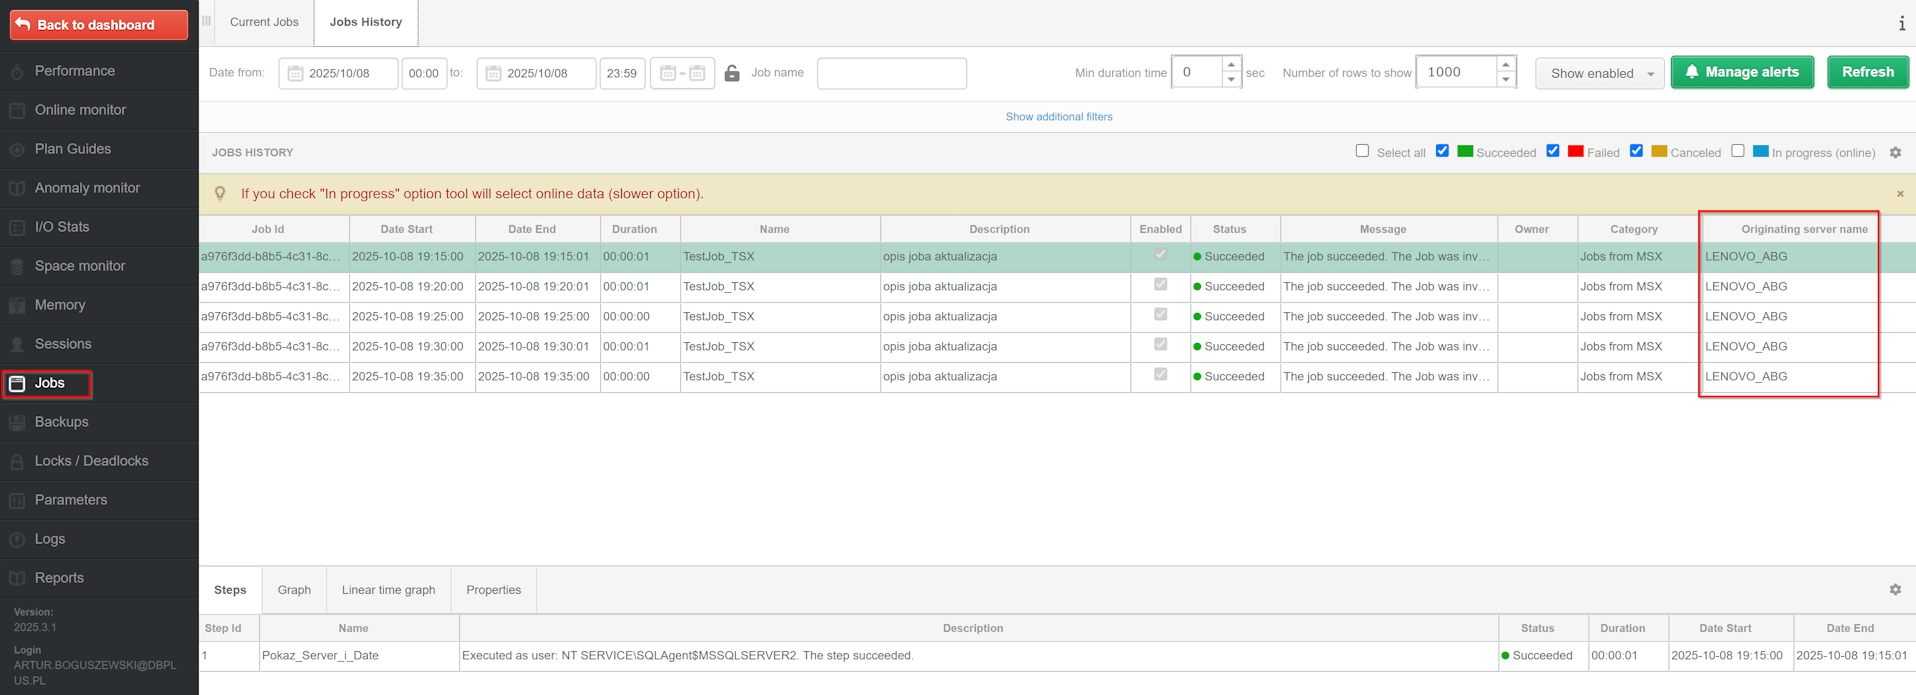
In parallel, we have improved the mechanism for configuring alerts for jobs performed on monitored instances. From now on the job name filter (JOB NAME FILTER LIST) supports logical operators such as LIKE, NOT, OR and AND, which allows you to build more precise conditions and better match alerts to real administrative needs. In practice, the user can use the alias {JOB_NAME} and create extensive rules, for example: {JOB_NAME} LIKE '%DBPLUS%'AND {JOB_NAME} NOT LIKE '%TEST%'to monitor only selected task groups. It is worth remembering that the monitoring of MSX jobs requires granting additional permissions - when updating the application, you will be informed about the need to refresh the permissions and grant access to the view msdb.dbo.sysoriginatingservers for the user monitoring a given SQL instance.
In the latest version of DBPLUS Performance Monitor we have added a new report Missing Indexes, which helps you quickly identify potential areas for performance optimization in monitored SQL Server instances. The report is available directly from the monitored instance level in the menu Rapports and presents information about missing indexes based on current data from system views, without using data stored in the repository. The user can narrow the analysis to a selected table and indicate a specific database from the list of available databases, with the report skipping system databases by default. Thanks to this, administrators and database specialists getfast, convenient and practical insight into where it is worth considering additional optimization.
It is worth noting that the report only indicates potential missing indixes, so any suggestion should be verified before implementation in the production environment. The scope of the data presented depends on the version of the monitored instance of SQL Server - depending on the version SQL Server 2019 additional information is available, such as Queries hash and Hash plan, which allows even more accurate analysis of problematic queries. In such cases, the user can use the option Show SQL details to quickly navigate to the details of a specific query.
Detailed information on changes for the platform SQL Server are available under links.
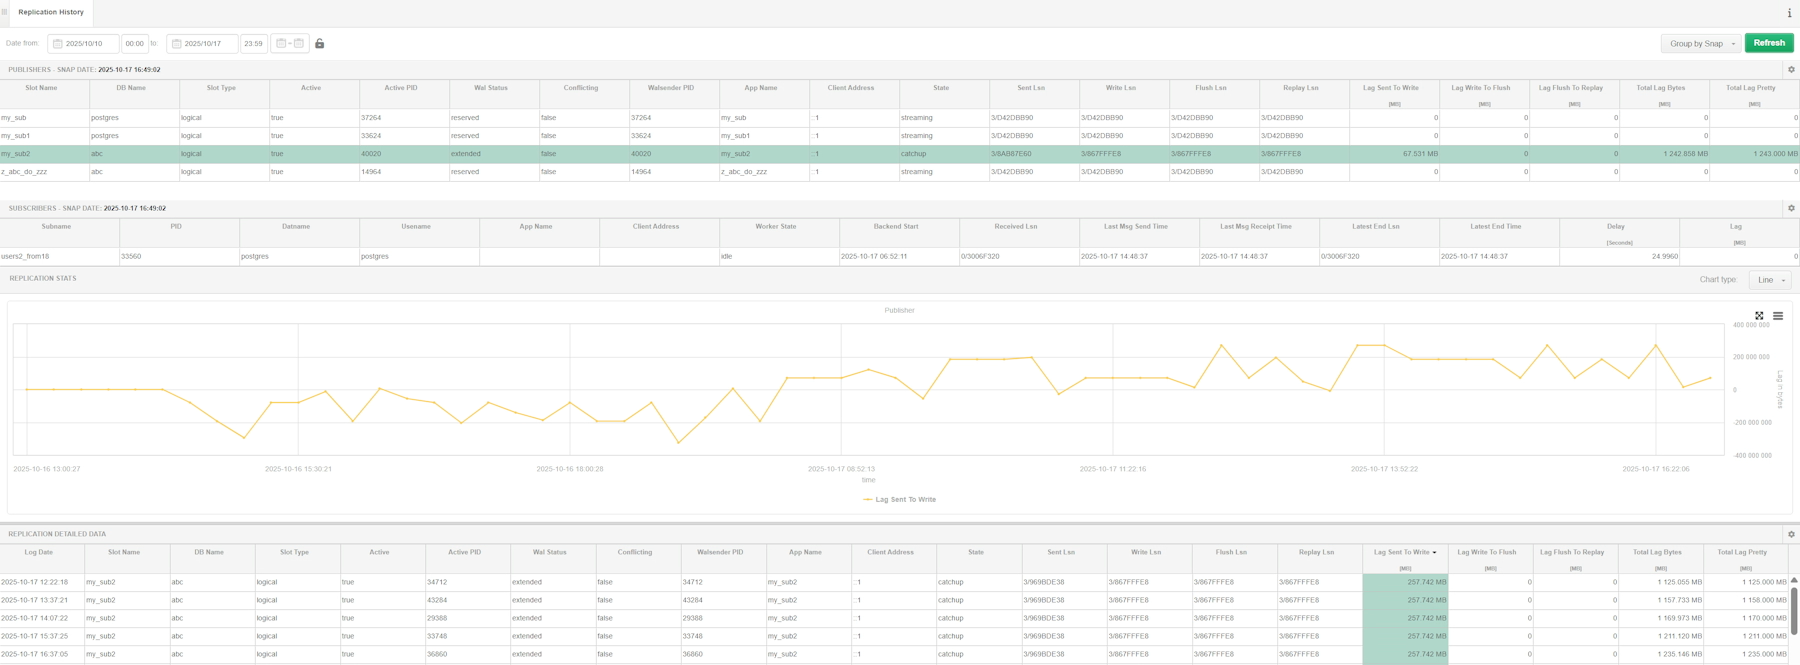
In the latest version of DBPLUS Performance Monitor, we have improved the functionality of logical replication monitoring by organizing the presentation of data and transferring all information to a new menu Replicacion at the level of the monitored instance. Today, you can analyze replication data collected every 15 minutes, allowing you to conveniently track its status and history in one place. The system automatically recognizes the role played by the PostgreSQL instance and presents the relevant sections on the screen based on this. For instances publishing data, a section is visible Publishers, and for instances subscribing to changes — section Subscribers. If an instance performs both roles simultaneously, the user gets a full view of the status of both the publication and the subscription. After selecting the selected row, you can proceed to a detailed analysis of the replication in the graph and in the table that presents the data from the last snapshot and the history of changes.
The new data presentation makes it much easier to assess replication health and to identify possible delays or synchronization problems faster.
Detailed information on changes for the platform PostgreSQL are available under links.
The changes introduced show the direction of development of DBPLUS Performance Monitor as a tool that not only monitors the database environment, but also actively supports its security, stability and performance. MFA strengthens application access protection, MSX job monitoring makes it easier to manage tasks in SQL Server environments, missing indexes report helps you identify potential optimization areas faster, and a new PostgreSQL logical replication monitoring approach increases analysis clarity and makes it easier to diagnose lags. Together, they create a consistent set of improvements, which translates into greater convenience for administrators and better control over key processes in monitored instances.